Exploring and mitigating shortcomings in single-cell differential expression analysis with a new statistical paradigm
Last updated: 2025-02-22
Checks: 2 0
Knit directory: DEanalysis/
This reproducible R Markdown analysis was created with workflowr (version 1.7.1). The Checks tab describes the reproducibility checks that were applied when the results were created. The Past versions tab lists the development history.
Great! Since the R Markdown file has been committed to the Git repository, you know the exact version of the code that produced these results.
Great! You are using Git for version control. Tracking code development and connecting the code version to the results is critical for reproducibility.
The results in this page were generated with repository version 70f95bc. See the Past versions tab to see a history of the changes made to the R Markdown and HTML files.
Note that you need to be careful to ensure that all relevant files for
the analysis have been committed to Git prior to generating the results
(you can use wflow_publish or
wflow_git_commit). workflowr only checks the R Markdown
file, but you know if there are other scripts or data files that it
depends on. Below is the status of the Git repository when the results
were generated:
Ignored files:
    Ignored:    .Rhistory
    Ignored:    .Rproj.user/
    Ignored:    data/.Rhistory

Untracked files:
    Untracked:  .DS_Store
    Untracked:  .gitignore
    Untracked:  analysis/analysis_humanspine.Rmd
    Untracked:  data/.DS_Store
    Untracked:  data/10X_inputdata.RData
    Untracked:  data/10Xdata_annotate.rds
    Untracked:  data/Bcells.Rmd
    Untracked:  data/Bcellsce.rds
    Untracked:  data/Kang_DEresult.RData
    Untracked:  data/Kang_data.RData
    Untracked:  data/fallopian_DEresult.RData
    Untracked:  data/fallopian_tubes.RData
    Untracked:  data/fallopian_tubes_all.RData
    Untracked:  data/human/
    Untracked:  data/human_spine.RData
    Untracked:  data/human_spine_DEresult.RData
    Untracked:  data/ls_offset_Result.RData
    Untracked:  data/mouse/
    Untracked:  data/permutation.RData
    Untracked:  data/permutation13.RData
    Untracked:  data/permutation2.RData
    Untracked:  data/splatter_simulation.RData
    Untracked:  figure/

Unstaged changes:
    Modified:   analysis/FD_analysis.Rmd
    Modified:   analysis/Kang_overview.Rmd
    Modified:   analysis/analysis on Kang.Rmd
    Modified:   analysis/fallopian_tubes_overview.Rmd
    Modified:   analysis/group8_17-2_19.Rmd
    Modified:   analysis/preprocess_human_spine.Rmd
    Modified:   code/DE_methods.R
Note that any generated files, e.g. HTML, png, CSS, etc., are not included in this status report because it is ok for generated content to have uncommitted changes.
These are the previous versions of the repository in which changes were
made to the R Markdown (analysis/index.Rmd) and HTML
(docs/index.html) files. If you’ve configured a remote Git
repository (see ?wflow_git_remote), click on the hyperlinks
in the table below to view the files as they were in that past version.
| File | Version | Author | Date | Message |
|---|---|---|---|---|
| Rmd | 70f95bc | C-HW | 2025-02-22 | rename title |
| html | d5f3a56 | C-HW | 2025-02-22 | Build site. |
| Rmd | 218b144 | C-HW | 2025-02-22 | rename title |
| html | 8bafc83 | C-HW | 2024-11-09 | Build site. |
| Rmd | 0778925 | C-HW | 2024-11-09 | add splatter results, ls analysis |
| html | e612161 | C-HW | 2024-10-19 | Build site. |
| Rmd | 595d960 | C-HW | 2024-10-19 | panel3 path |
| html | cec1730 | C-HW | 2024-10-19 | Build site. |
| Rmd | 1cf8a71 | C-HW | 2024-10-19 | add human spine |
| html | 4085205 | C-HW | 2024-10-19 | Build site. |
| Rmd | 6480f5c | C-HW | 2024-10-19 | add human spine |
| html | eaef811 | C-HW | 2024-10-14 | Build site. |
| Rmd | bfc6200 | C-HW | 2024-10-14 | workflowr::wflow_publish("index.Rmd") |
| html | 42769e7 | C-HW | 2023-12-15 | Build site. |
| Rmd | da950e4 | C-HW | 2023-12-15 | remove about data |
| html | 76c848a | C-HW | 2023-12-15 | Build site. |
| Rmd | cf1ad3a | C-HW | 2023-12-15 | revise order on index page |
| html | e10a256 | C-HW | 2023-12-15 | Build site. |
| Rmd | 2b477ad | C-HW | 2023-12-15 | revise order on index page |
| html | 2fba81e | C-HW | 2023-12-15 | Build site. |
| Rmd | ea89e68 | C-HW | 2023-12-15 | revise order on index page |
| html | 463f4a9 | C-HW | 2023-12-09 | Build site. |
| html | 59bf327 | C-HW | 2023-12-01 | Build site. |
| html | d05c068 | C-HW | 2023-12-01 | Build site. |
| html | 802697b | C-HW | 2023-12-01 | index html |
| Rmd | 3803697 | C-HW | 2023-12-01 | upload rmd |
| html | 3803697 | C-HW | 2023-12-01 | upload rmd |
| Rmd | a0d06fe | C-HW | 2023-12-01 | recover index |
| html | a0d06fe | C-HW | 2023-12-01 | recover index |
| html | 828d72e | C-HW | 2023-12-01 | update index.html |
| html | 9daafa5 | C-HW | 2023-11-30 | index small adjustment |
| html | 59b08c2 | C-HW | 2023-11-29 | update index, FD permuation, plots axes |
| html | e5cde05 | C-HW | 2023-11-13 | update index page |
| html | fc4ab47 | C-HW | 2023-08-03 | data2 results |
| html | 5ee9460 | C-HW | 2023-07-27 | update index.html |
| html | 949c760 | C-HW | 2023-07-27 | data2 |
| html | b688ebf | C-HW | 2023-07-13 | updatd index.html |
| html | 4da4a48 | C-HW | 2023-07-13 | update index.html |
| html | 35f04ca | C-HW | 2023-07-12 | add 12_19 |
| Rmd | 366cd53 | C-HW | 2023-06-06 | add group8_17&2_19 |
| html | 366cd53 | C-HW | 2023-06-06 | add group8_17&2_19 |
| html | 3b1c8ca | C-HW | 2023-05-25 | update index page |
| Rmd | 95be122 | C-HW | 2023-05-25 | update 2_19 |
| html | 95be122 | C-HW | 2023-05-25 | update 2_19 |
| Rmd | 2107af3 | C-HW | 2023-05-24 | add methods_details |
| Rmd | 9a7a569 | C-HW | 2023-05-18 | correct link |
| html | 9a7a569 | C-HW | 2023-05-18 | correct link |
| Rmd | 641a5d8 | C-HW | 2023-05-18 | add link to index |
| html | 641a5d8 | C-HW | 2023-05-18 | add link to index |
| Rmd | 13d726d | C-HW | 2023-05-18 | add DE results on different groups |
| html | 13d726d | C-HW | 2023-05-18 | add DE results on different groups |
| Rmd | fc9f4b6 | C-HW | 2023-05-18 | add new_criteria |
| html | fc9f4b6 | C-HW | 2023-05-18 | add new_criteria |
| html | 7586953 | C-HW | 2023-05-11 | add data_clusters |
| Rmd | 703eb54 | C-HW | 2023-05-09 | create workflowr |
| html | 703eb54 | C-HW | 2023-05-09 | create workflowr |
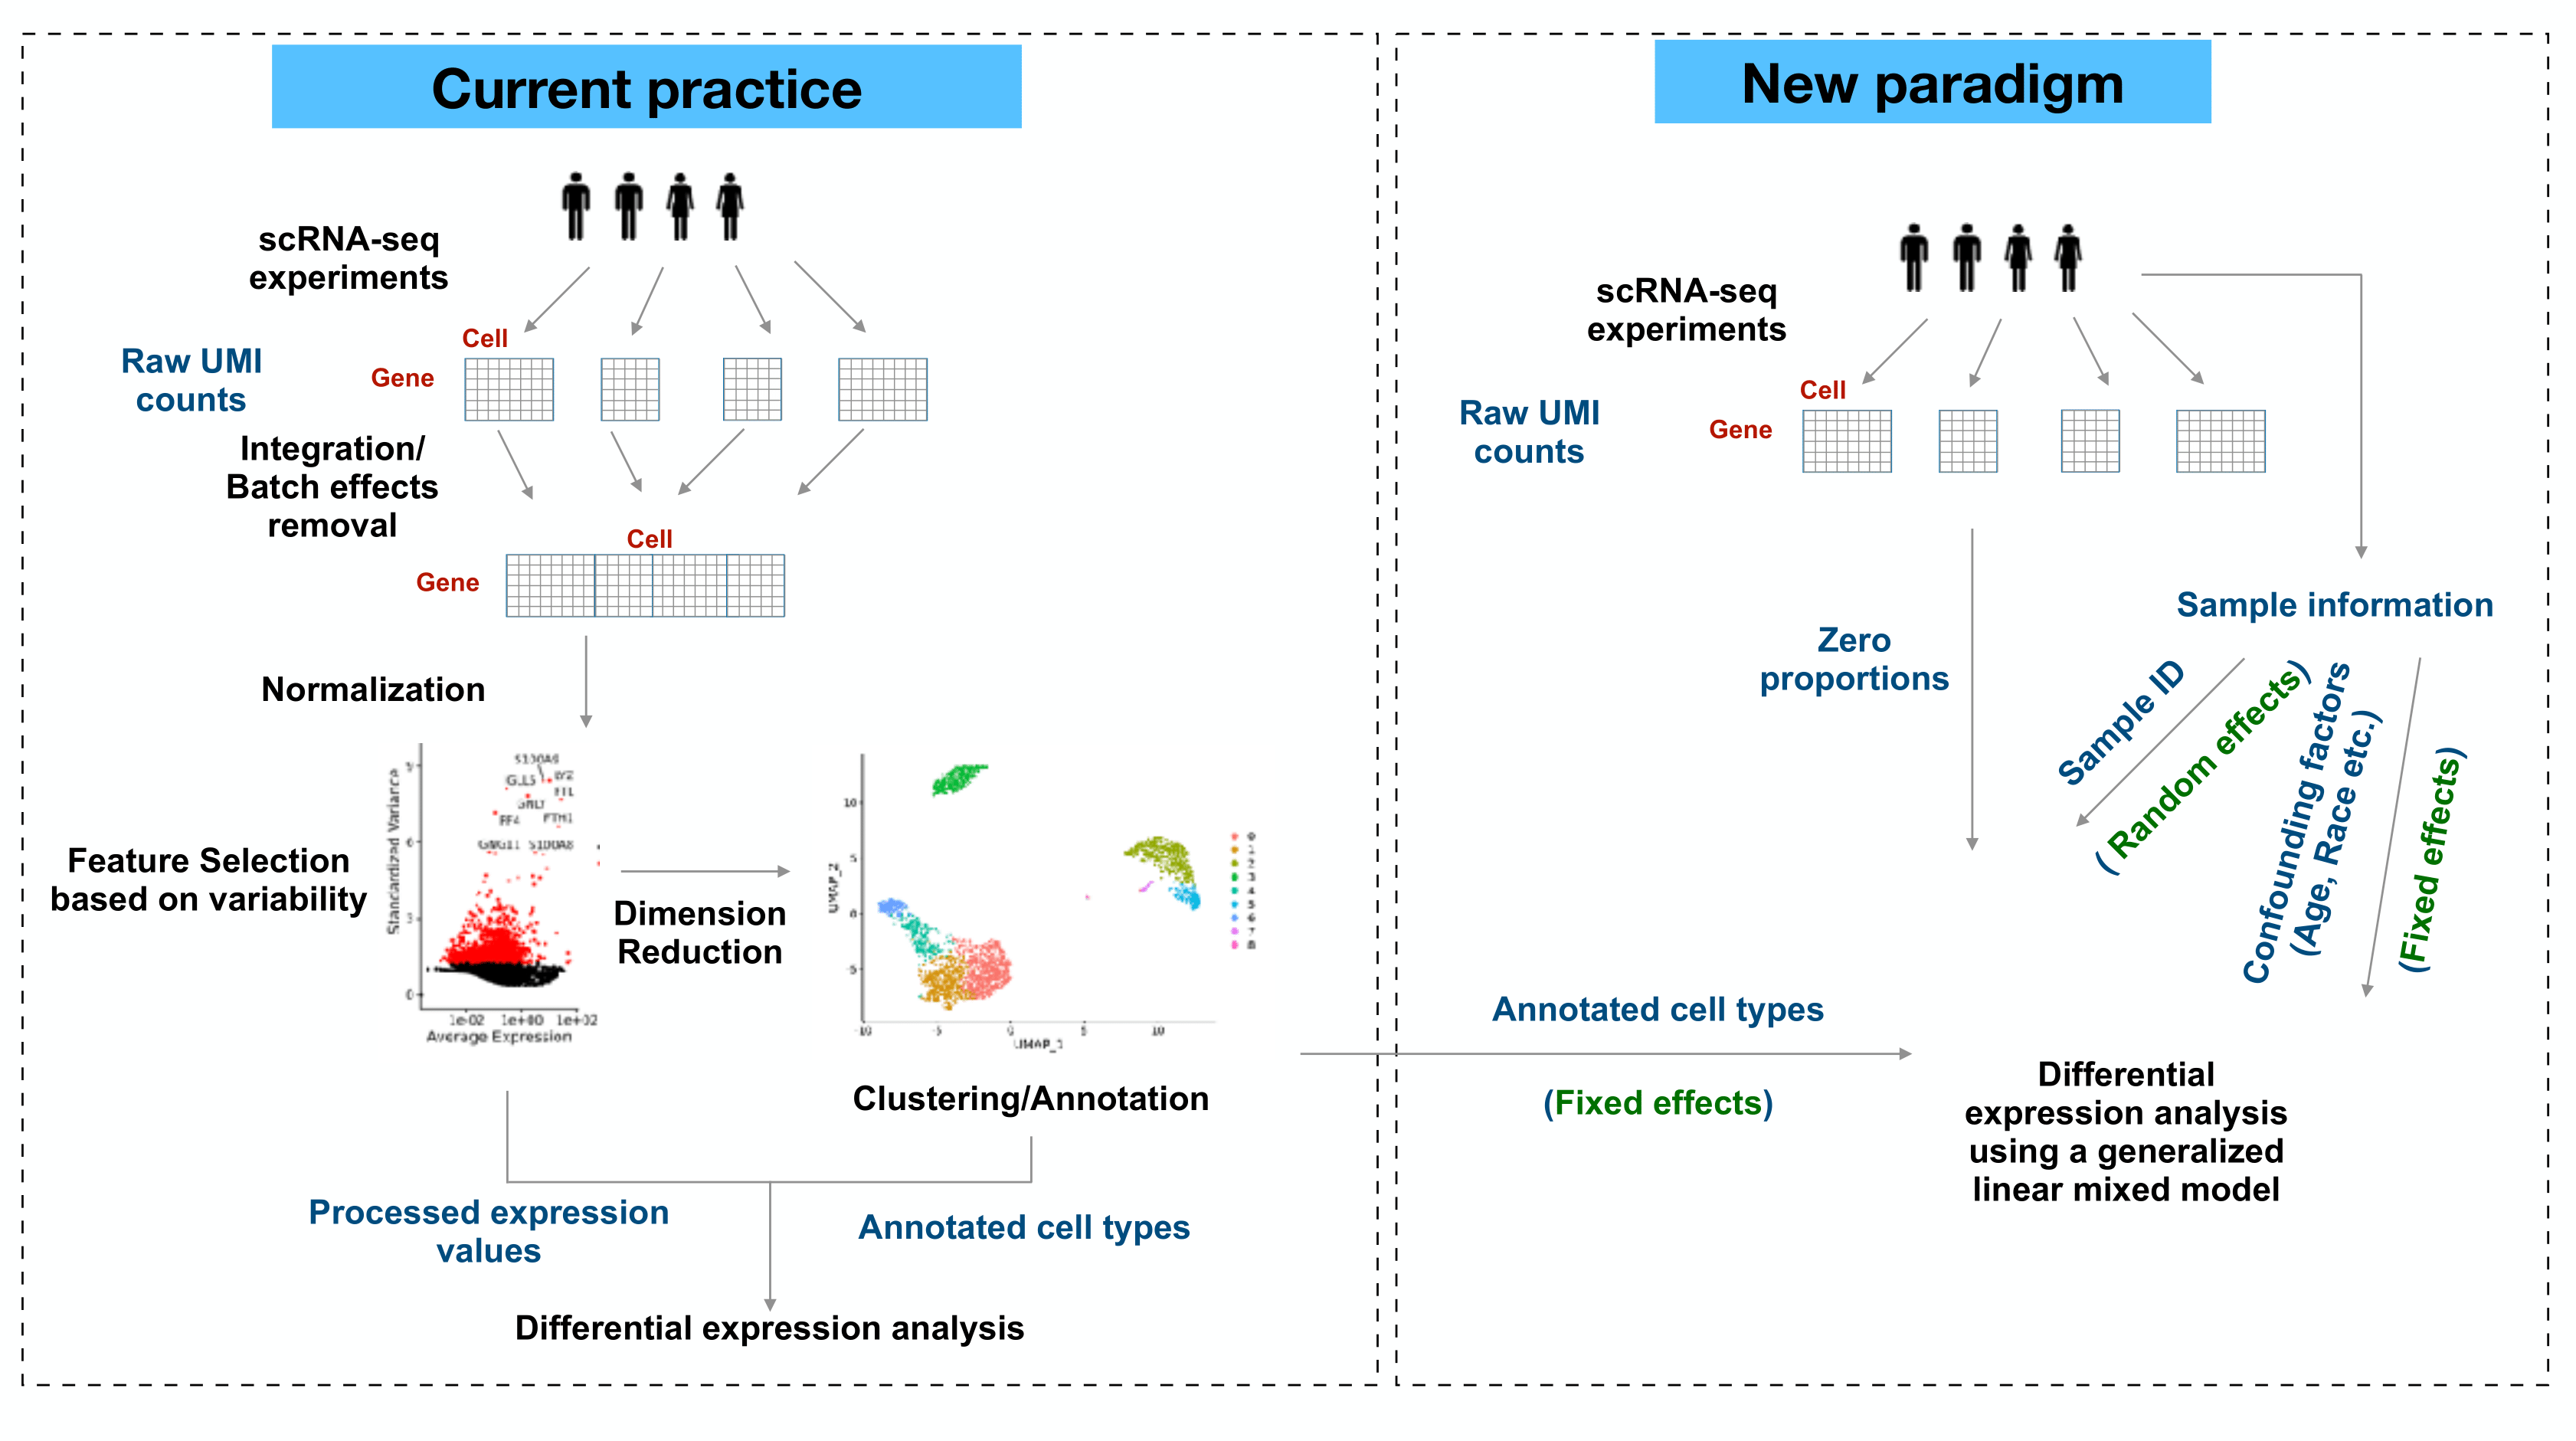
Motivation
Differential expression (DE) analysis in single-cell transcriptomics reveals cell-type-specific responses. Recent studies have raised concerns about current methods used to identify differentially expressed genes in this context.
scRNA sequencing provides the absolute abundances of RNA molecules in single cells, but normalization - a pre-processing step inherited from the bulk RNA-seq era - reduces this information and returns data as relative abundances, which may mask important differences among cell types
The majority of single-cell DE analysis methods are susceptible to generating false discoveries. This is mainly due to the lack of accounting for variations between biological replicates, commonly referred to as “donor effects”.
- Batch effects are often estimated from leading principal components, representing a consensus from most genes.
- Pseudo-bulk analysis ignores within-sample heterogeneity by treating donor effects as a fixed effect and assuming that each cell from the same donor is equally affected.
Clustering and DE analysis are different problems. The current commonly workflow works well in clustering, but cannot guarantee success in downstream analysis.
Excessive zeros are usually considered as “drop-outs”, while they are actually informative in cell-type heterogeneity. Ignoring zeros in single-cell gene expression data discards valuable information for any analysis.
We provided a generalized linear mixed model framework (GLIMES: Generalized LInear Mixed-Effects model for Single cell expression studies) to detect differentially expressed genes (DEGs) between two given cell types. The model takes donor-specific variations as random effects, and uses raw UMI counts to prevent biases in DE analysis.
GLIMES framework
By default, we excluded any genes detected in fewer than 5% cells in the compared groups from differential testing. The GLMMs were implemented with glmmPQL function of the MASS package. We calculated adjusted p-values by using Benjamini-Hochberg correction. Each model fitting was applied on one gene and the two compared groups.
Poisson-glmm
For each count \(X_{cgk}\) sampled from cell \(c\), donor \(k\), and gene \(g\),
\[ \begin{aligned} X_{cgk}|\lambda_{cgk} & \sim Poisson(\lambda_{cgk})\\ \log \lambda_{cgk} & = \mu_g + X_c{\beta_g} + \epsilon_{gk}\\ \end{aligned} \] where \(X_c\) is the indicator for group-of-interest (cell types, conditions, regions), and \(\epsilon_{gk}\sim N(0,\sigma_{g}^2)\) represents the random effects for donor \(k\). Our goal is to test \(H_0: \beta_g = 0\). Here \(e^{\beta_g}\) represents the fold change of gene \(g\) between group-of-interest.
Binomial-glmm
\[ \begin{aligned} \mathbb{1}_{X_{cgk}=0}|p_{cgk} & \sim Bernoulli(p_{cgk})\\ \log \frac{p_{cgk}}{1-p_{cgk}} & = \mu_g + X_c\beta_{g} + \epsilon_{gk}\\ \end{aligned} \] where \(X_c\) is the indicator for group-of-interest (cell types, conditions, regions), and \(\epsilon_{gk}\sim N(0,\sigma_{g}^2)\) represents the random effects for donor \(k\). Our goal is to test \(H_0: \beta_g = 0\).
For both methods, we provided “log2 fold change” computed by \(\log_2(\beta_g)\) . In Poisson-glmm, this estimate indicates the increment of \(\log_2(\lambda_2)\) against \(\log_2(\lambda_1)\), which is the conventional log2 fold change. However, this term in Binomial-glmm doesn’t represent the same meaning. It is the difference between logit(\(p_2\)) and logit(\(p_1\)). The p-value and BH adjusted p-value are provided.
Benchmarked methods
In this project, we compared a few methods performing the DE analysis results. Our comparison encompassed Poisson-glmm and Binomial-glmm from the new paradigm, as well as pseudo-bulk approaches including DESeq2 and edgeR. Additionally, we assessed the performance of single cell specific tools including MAST, Wilcox in Seurat, and linear mixed models in Muscat. More details can be found here.
Application
Case study 1 (Fallopian tubes immune cells)
In case study 1, a 10X scRNA-seq dataset of post-menopausal fallopian tubes, with 57,182 cells sourced from five donors, covering 29,382 genes is analyzed. The 20 clusters are obtained via HIPPO algorithm. There is no pre-filtering procedure applied on this dataset, except for built-in filtering steps in each method. We use sctransform to get the VST data, and the integration workflow (v4) provided by Seurat to obtain the integrated data.
Case study 2 (Human spine cells)
In case study 2, the dataset contains scRNA-seq data from 9 patients and sequenced in 16 slides. The dataset consists of a total of 48644 cells. After removing ambiguous genes and only keeping common genes across all samples, it includes sequencing data for 8092 genes.
Case study 3 (Lupus patients with treatment)
In case study 3, the dataset contains 10X droplet-based scRNA-seq data from 8 Lupus patients obtained before and after 6h-treatment with IFN-β. After removing undetected genes and lowly expressed genes (less than 10 cells expressing more than 1), the dataset consists of 29065 cells and 7661 genes. The integrated data is replaced by log2-transformed normalized expression values obtained via computeLibrarayFactors and logNormCounts functions in Muscat.
Analyses
Simulation studies
Permutation analysis
To examine the p-value calibration in real data, we did a permutation analysis on group-of-interest within a null dataset. The results can be found here.
Simulated scRNA data generated by Splatter
We provided FDR, power and runtime on different configuration on Splatter simulator results.
New criteria on determining DEGs
We proposed new criteria that based on the convention and also the gene mean and the difference in mean. If the log2 gene mean in two groups is lower than a certain value (-2.25 in case study 1) and the log2 mean difference is smaller than a threshold (-1 in case study 1), the genes would not be considered as a DEGs. These can also be used as a filter before any DE analysis to speed up the computation. Both of these criteria are adjustable, depending on the dataset’s performance and characteristics. An examination in heatmaps and mean difference against mean plot in advanced can be helpful to determine the thresholds when analyzing a new dataset. More details can be found here.